The Southern Sustainable Agriculture Working Group (SAWG) provides a brief annual report to its board and constituents. The organization wants to share a recap of the previous year’s highlights in an easy-to-read format.
Solution
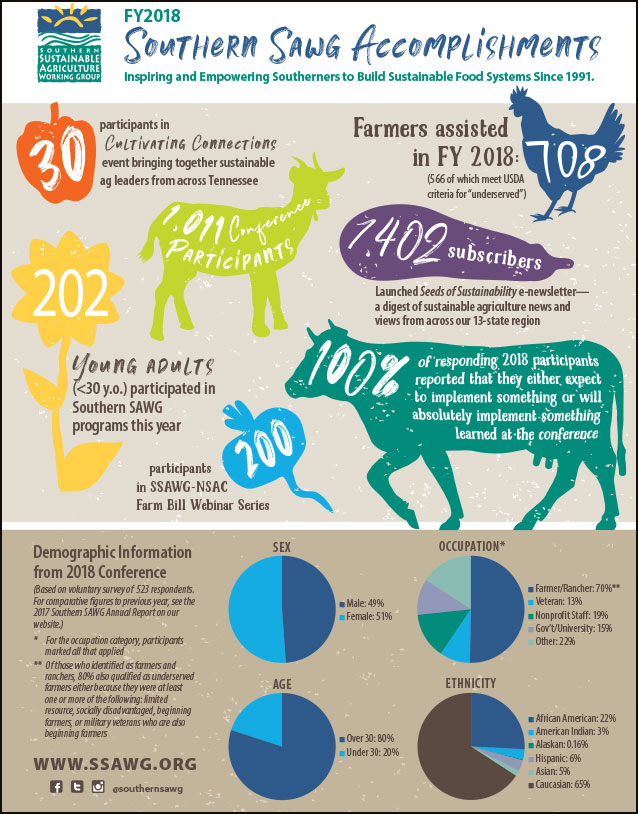
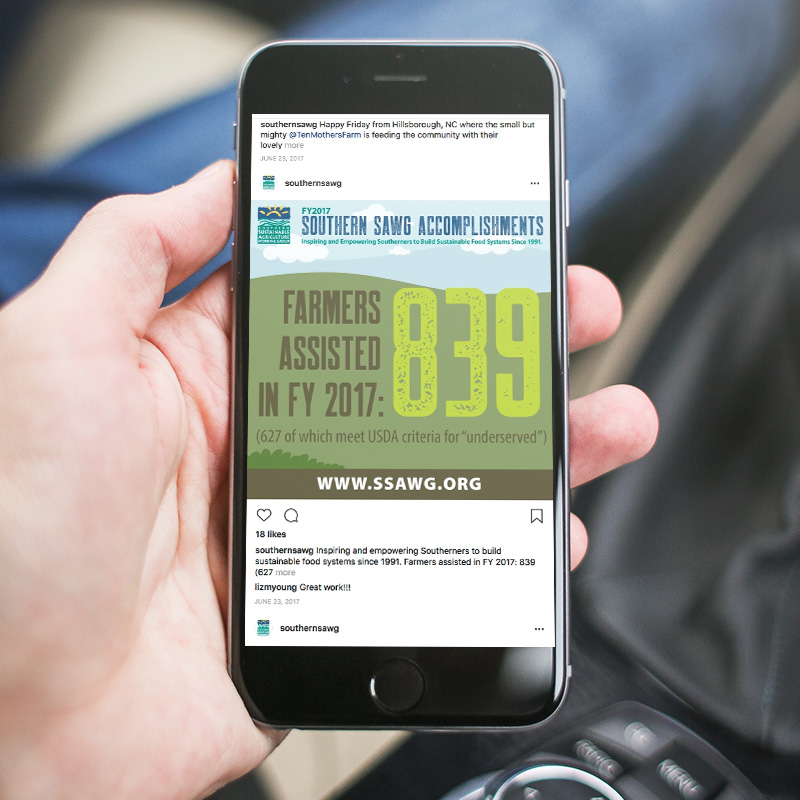
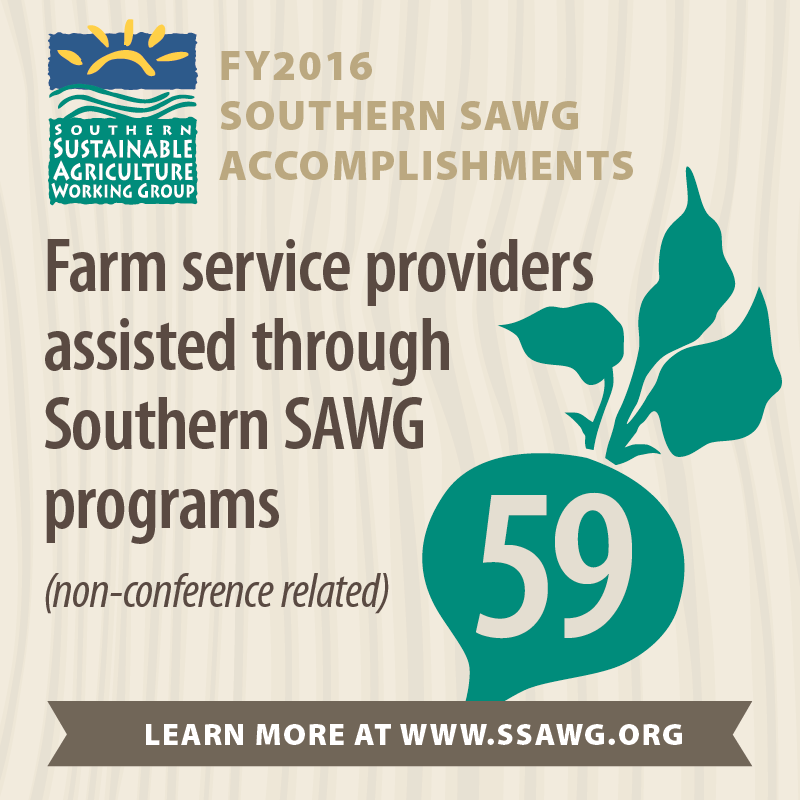
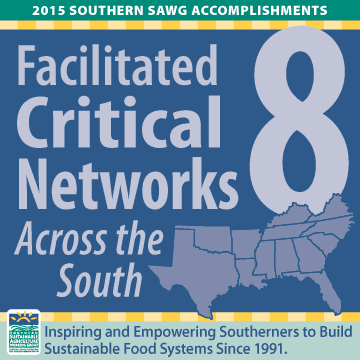
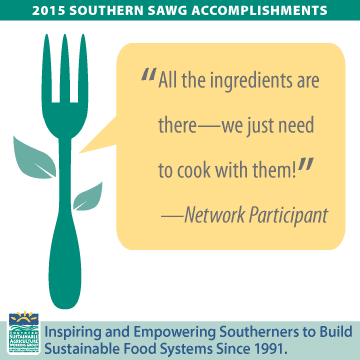
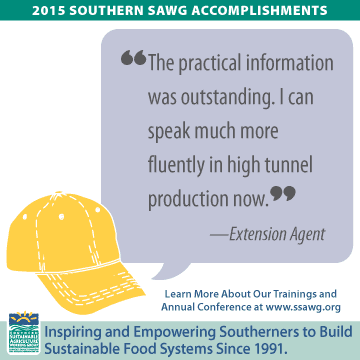
An 8.5″x11″ infographic is created as a page for the annual report as well as a stand-alone one pager. The individual data elements are then isolated to be used on the website and in social media posts. Or in the case of fiscal year 2018, incorporated into a video.
Services
Design infographics
Social media and website graphics
Social media content and posting
Annual report design
Video design and editing
2018 Infographics
One Page Flier
For 2018, instead of making social media graphics. I created a short video that highlighted the accomplishments of the year, interlaced with photos that supported the infographic elements.